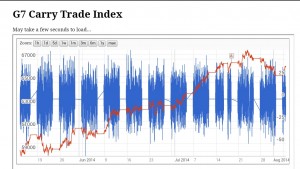
“For a number of years we had a very nice off-the-shelf solution for our media piece – the G7 CTI chart. We could simply use the standard charting solution off of Google Docs™ program and add it to our website. As time has gone on and best-practices have changed – particularly in the mobile / smartphone space, we have had to adapt our old Flash-based media creatives to HTML5, which has better acceptance over a broader range of devices,” according to Barry Livingstone of Onefineham Internet Marketing.
What’s New with the G7 Carry Trade Index?
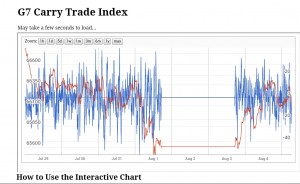
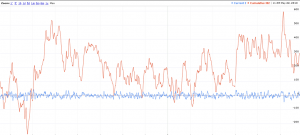
One of the important changes to the index is the addition of a second axis, splitting the two sets of data (current and cumulative readings). This allows users to see with much greater clarity how the current reading is impacting the longer term trend. “The utility of the chart is much greater now when looking at shorter time horizons,” added Livingstone.
Future Plans Include WordPress Widget
“The flexibility of the Google visualizations platform is that it can allow big data charts to be packaged into smaller, more palatable chunks for webmasters. Large data intensive apps and widgets can slow load times for websites, reducing the utility of the user experience,” said Livingstone. “Carving up the data into smaller bits can make the webmasters a little happier with load times without sacrificing much of the chart’s overall utility to the end user. We’re really happy to be taking our work in a new direction.”
Portions of this page are modifications based on work created and shared by Google and used according to terms described instore Creative Commons 3.0 Attribution License.
Google Docs™ is a trademark of Google, Inc.
The G7 Carry Trade Index was designed in collaboration with 3$H Options Trading.


